Monitoring and metrics
Marmot shows how your catalog is used on the Insights page, and can expose Prometheus metrics for your own monitoring.
Catalog insights
Open Insights and choose Catalog. It shows asset views, searches, stale assets and how many assets have an owner, then the most viewed assets, top searches, searches that found nothing, top owners, asset types and top data providers. The time range applies to the whole page.
The catalog view of Insights:
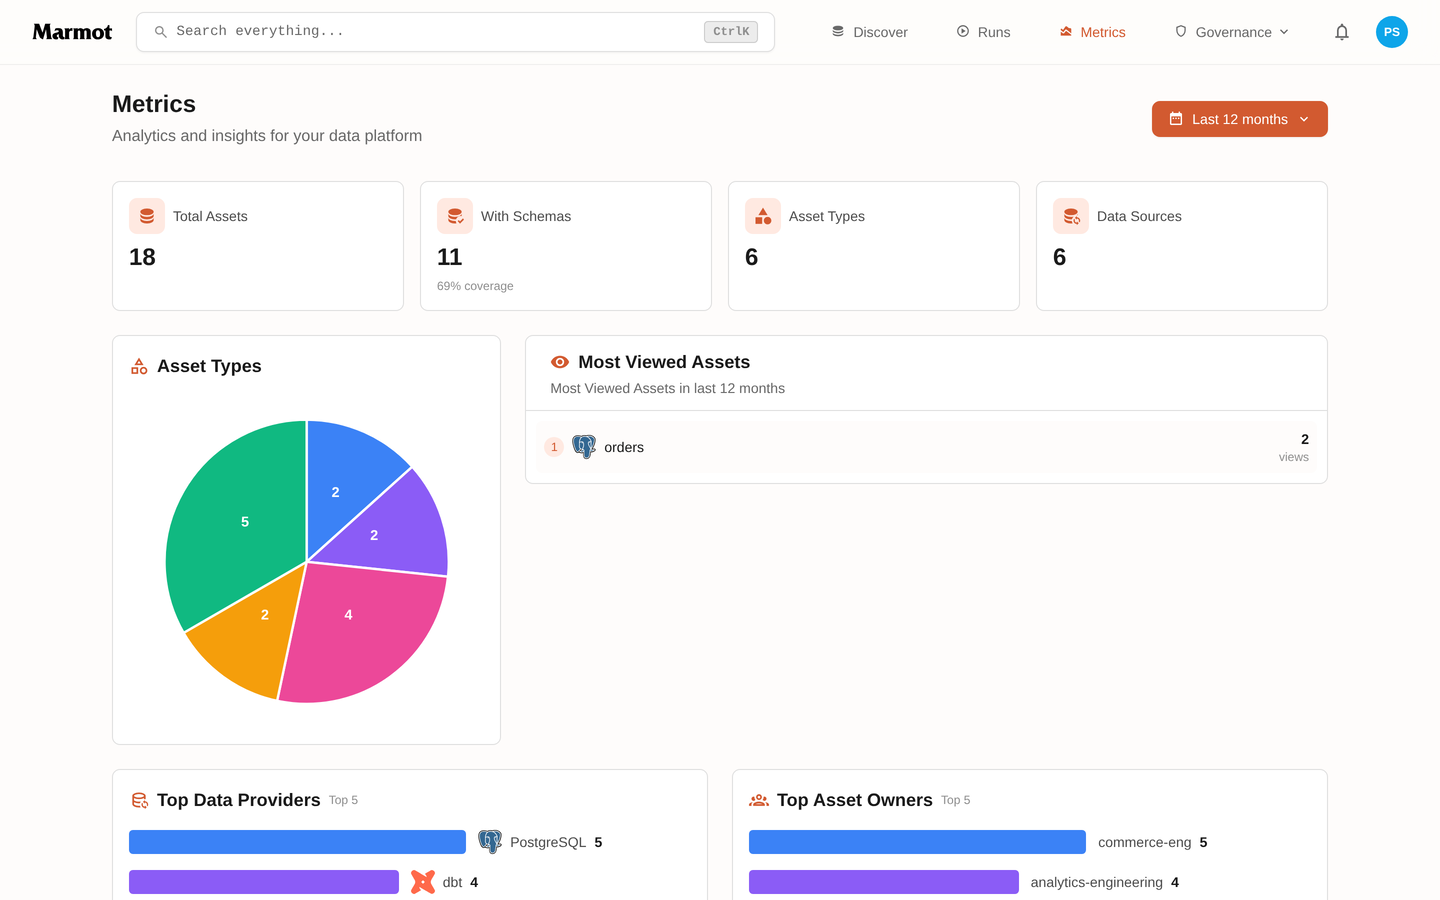
Searches that found nothing is the list worth watching: each entry is something people looked for and the catalog couldn't answer. Seeing the catalog view needs the metrics:view permission. See users, roles and access.
The Data queries view sits beside it for people who can query data or read the query log.
Prometheus
Turn on the metrics listener in config.yaml. It serves /metrics on its own port, without authentication, so keep that port off the public internet and let Prometheus scrape each Marmot instance:
metrics:
  enabled: true
  port: 9090
Or with environment variables:
MARMOT_METRICS_ENABLED=true
MARMOT_METRICS_PORT=9090
With the Helm chart
The chart can create a ServiceMonitor for the Prometheus Operator:
config:
  metrics:
    enabled: true
    port: 9090

monitoring:
  serviceMonitor:
    enabled: true
    interval: 30s
Next steps
- Configuration reference: every metrics setting, including which providers and asset types count towards schema coverage.
- Helm and Kubernetes: deploy Marmot with the chart.